
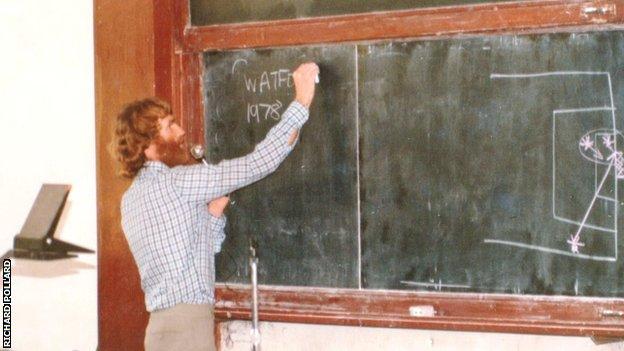
It was another gorgeous day in Fiji as Richard Pollard arrived to work at the University of the South Pacific in March 1986.
Checking his pigeon-hole on the way to his office he found a padded envelope among the usual correspondence. It had an airmail sticker and a postmark from Watford, England.
Inside was a VHS videocassette and a letter. The tape contained recordings of Watford matches against Chelsea in the First Division and Crewe Alexandra in the Milk Cup. The letter was from Watford manager Graham Taylor, who politely asked for the cassette to be returned to England “together with an analysis in due course” .
This is how match analysis was carried out by a top-level English club in the 1980s – trusting the only tape recording of a game to long-distance airmail, having the analysis done by hand and then returned over 12 months later.
By the mid-1980s, Pollard had already been fascinated by football data for over two decades. Like other fledgling analysts of the 1960s, he’d read the earliest published works of Charles Reep (1904-2002), seen by some as the Godfather of modern football analysis.
Reep was the first data analyst to work directly with a professional football club, starting at Brentford in 1951 and finding great success with Wolves later in the same decade.
Pollard was one of several people inspired by Reep’s work to visit his Plymouth home, a pilgrimage that usually involved long afternoons of tea, sandwiches and football discussion.
By the time of Pollard’s first visit in the mid-1960s, Reep had accumulated hundreds of matches worth of data detailing passing moves, attempts at goal or where teams won and lost possession. In his cozy front room, piles of handwritten notes, typed-out formulas and large boards showing the latest match diagrams would be pored over and dissected.
Reep had developed a unique technique that allowed him to collate data for each team in real time. The problem was he had to do everything by hand. To prepare a chart from his notes of every passing move from, say, the 1958 World Cup final, he would spend 80 hours working on it. Pollard would soon be able to work much faster.
“When the computer revolution started, not to be left behind, I did a degree in applied computer science,” Pollard says. “One course was statistical computing. I soon realized that Reep’s data slow itself to the sort of multivariate analysis that could only be done on a computer.”
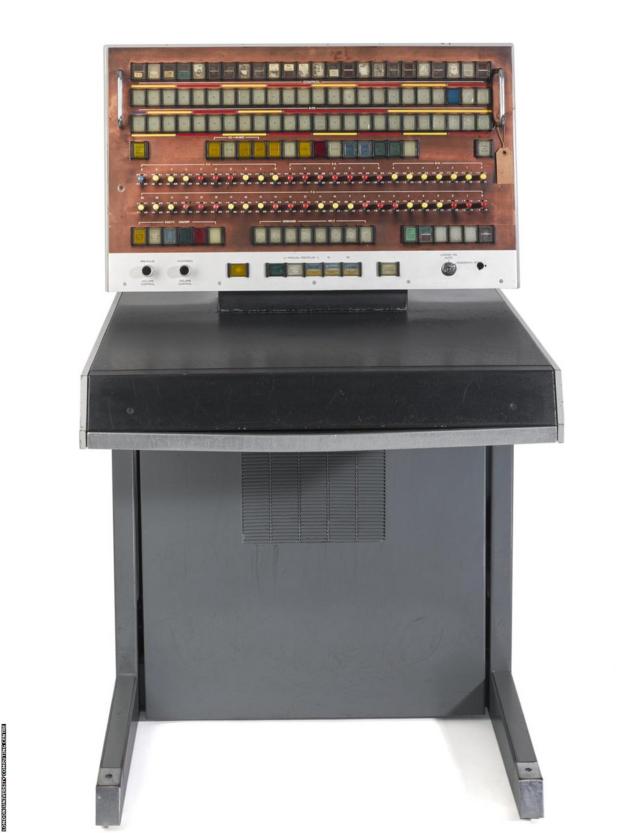
The computer in question, the Atlas 1, is now homed at the Science Museum in Kensington but between 1964 and 1972 it was in place at Gordon Square in Bloomsbury for use by the University of London. Within handsome Georgian terraces was hidden the windowless concrete bunker that housed the computer. Students rarely got to see it in action.
Anyone requiring use of the Atlas machine would punch a series of cards, drop them at reception and return 24 hours later to pick up the printout of their results. This is what Pollard did in February 1969, thus becoming the first person to carry out analysis of a football match using a computer.
“Reep sent me summary performance data for 100 matches,” says Pollard. “Each team, for each match, had 68 different performance measures. So that was a total of 13,600 values.
“The initial aim of the analysis was first to summarize the distribution of values for each of the 68 variables: mean, standard deviation etc. Then to test to see which values differed significantly between winning and losing teams.”
Early results were inconclusive but Reep continued amassing more data. Meanwhile, Pollard was on the move again, this time for two years at university in Belo Horizonte, Brazil.
When he returned to England in 1975, he bought a house that happened to be about a mile down the road from football manager Graham Taylor. Now things really took off.
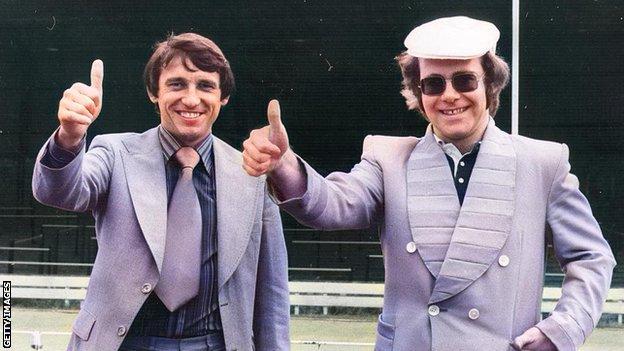
Pollard soon realized that Taylor liked to employ an all-out attacking style similar to that favored by Reep, so he put them in touch. This led to Pollard analyzing games during the 1980-81 season as Watford finished ninth in the Second Division.
“The second game I recorded was when Watford beat Southampton [in the League Cup],” recalls Pollard.
“Southampton were riding high in Division One and they won the first leg 4-0 at The Dell, but Watford took the second leg 7-1. In a subsequent round they beat Nottingham Forest, the European Cup holders, 4-1. Another ‘night of nights’ as Reep called it.”
Pollard worked with Reep in monitoring a range of metrics, beyond simple shots, corners and offsides. The key measure was a ‘reacher’, the number of times a team managed to pass the ball into the attacking third. A ‘static’ was a throw-in, corner, or free-kick in the attacking third. A ‘regained possession’ measured how many times a team won the ball back in the attacking third through pressing.
All of these measures are known to be important in winning football matches and form the backbone of modern analysis. Pollard was doing this under the radar 40 years ago.
Soon he was on the move again, this time to a university job in Fiji, where he continued his football analysis in his spare time, providing in-game stats for local radio and writing a column for the Fiji Sun newspaper.
He recalls: “In the 1985 Fijian Cup final, during my half-time summary I commented that the two teams were exactly matched on shots and ‘reachers’ and said it would take more than penalties to separate them. Several hours later, with penalties tied at 12-12, darkness had fallen and the game was declared a draw.”
Pollard’s work permit at the university didn’t allow him to be paid for any outside work, so his newspaper editor would assign him to games on the far side of the islands and pay generous expenses.
“I used to take the whole family in our little Suzuki Jeep on these free long weekends in hotels on the beach,” he says.
“I used to tell the editor that his readers were better informed about football than anywhere else in the world!
“But there was no television coverage in Fiji. My father used to send me World Cup video recordings from England and I could then replay them in the video lab as many times as I wanted.”
Access to video footage opened up new opportunities for analysts at this time. It allowed more aspects of the game to be investigated and some counterintuitive findings were unearthed. When Taylor sent his video, Pollard found that Watford conceded more attempts at their goal when they had more defenders back in the penalty area, for example.
He also spent time accurately noting the position of each attempt at goal. He explained this to Taylor in a letter sent in January 1986. Pollard later expanded this into a paper he wrote at the University of the South Pacific titled ‘Soccer Performance Analysis and its Application to Shots at Goal’. It was the seed from which the expected goals metric has flourished.
Pollard’s paper used data from different divisions of English football between the late 1950s and 1980s, the 1982 World Cup, the North American Soccer League and, of course, the Fiji National League. In total around 20,000 shots were included in the study, revealing similar results across the leagues and decades.
It showed that between 9% and 13% of all shots produced a goal and the goal-to-shot ratio was in the range 8.2 to 10.6. Further insights were gleaned from the distribution of shots attempted from inside and outside the penalty area.
Inside-the-area shots produced goals from 15% of attempts while this figure dipped to just a 3% success rate from outside the box. Such figures might seem reassuringly familiar to analysts today but 40 years ago it was pioneering work.

Pollard’s work on shot locations would continue but his association with Taylor petered out.
“The timing was bad,” says Pollard. “There was a military coup in Fiji, so I didn’t renew my contract at the university and headed for the United States without a job, while at the same time [Taylor] was in the process of leaving Watford for Aston Villa.”
Taylor’s rise saw him eventually become England manager. When Norway defeated his side 2-0 in a 1994 World Cup qualifier played in Oslo they had another Reep-disciple at the helm, Egil Olsen. Reep himself was at the game as a guest of the Norwegian Football Association.
Pollard settled in California and went on to devise a method of ranking national teams that was rejected by Fifa but seems to give more accurate results. He has traveled to Malawi and China to give analysis talks and he advised Bhutan on how to maximize their Fifa ranking, helping them move up 40 places in the process.
And expected goals (or xG) have, at least in some people’s eyes, become the go-to metric for assessing a side’s long-term success. These underlying figures could be said to give a better chance of judging a team’s overall performance – uninfluenced by individual factors such as error or brilliance – than actual results.
Like much of the history of football analysis, Pollard was at the center of this revolution as well.
Reference-www.bbc.co.uk