For Maclean’s Eighth Annual Charting Travaganza, we have once again asked dozens of economists and analysts to reflect on the year ahead and choose a chart that will help define Canada’s economy in 2022 and beyond, and explain this outlook in their own words.
This year, we’ve decided to post the charts for multiple days, making this more of a Charting Week than a one-day data binge. We’ll also cover jobs and income, inflation, COVID, and, yes, don’t worry, real estate outlook.
Sale of electric cars, supercharged
Nicholas rivers, Associate Professor, Institute for the Environment, University of Ottawa @riversNic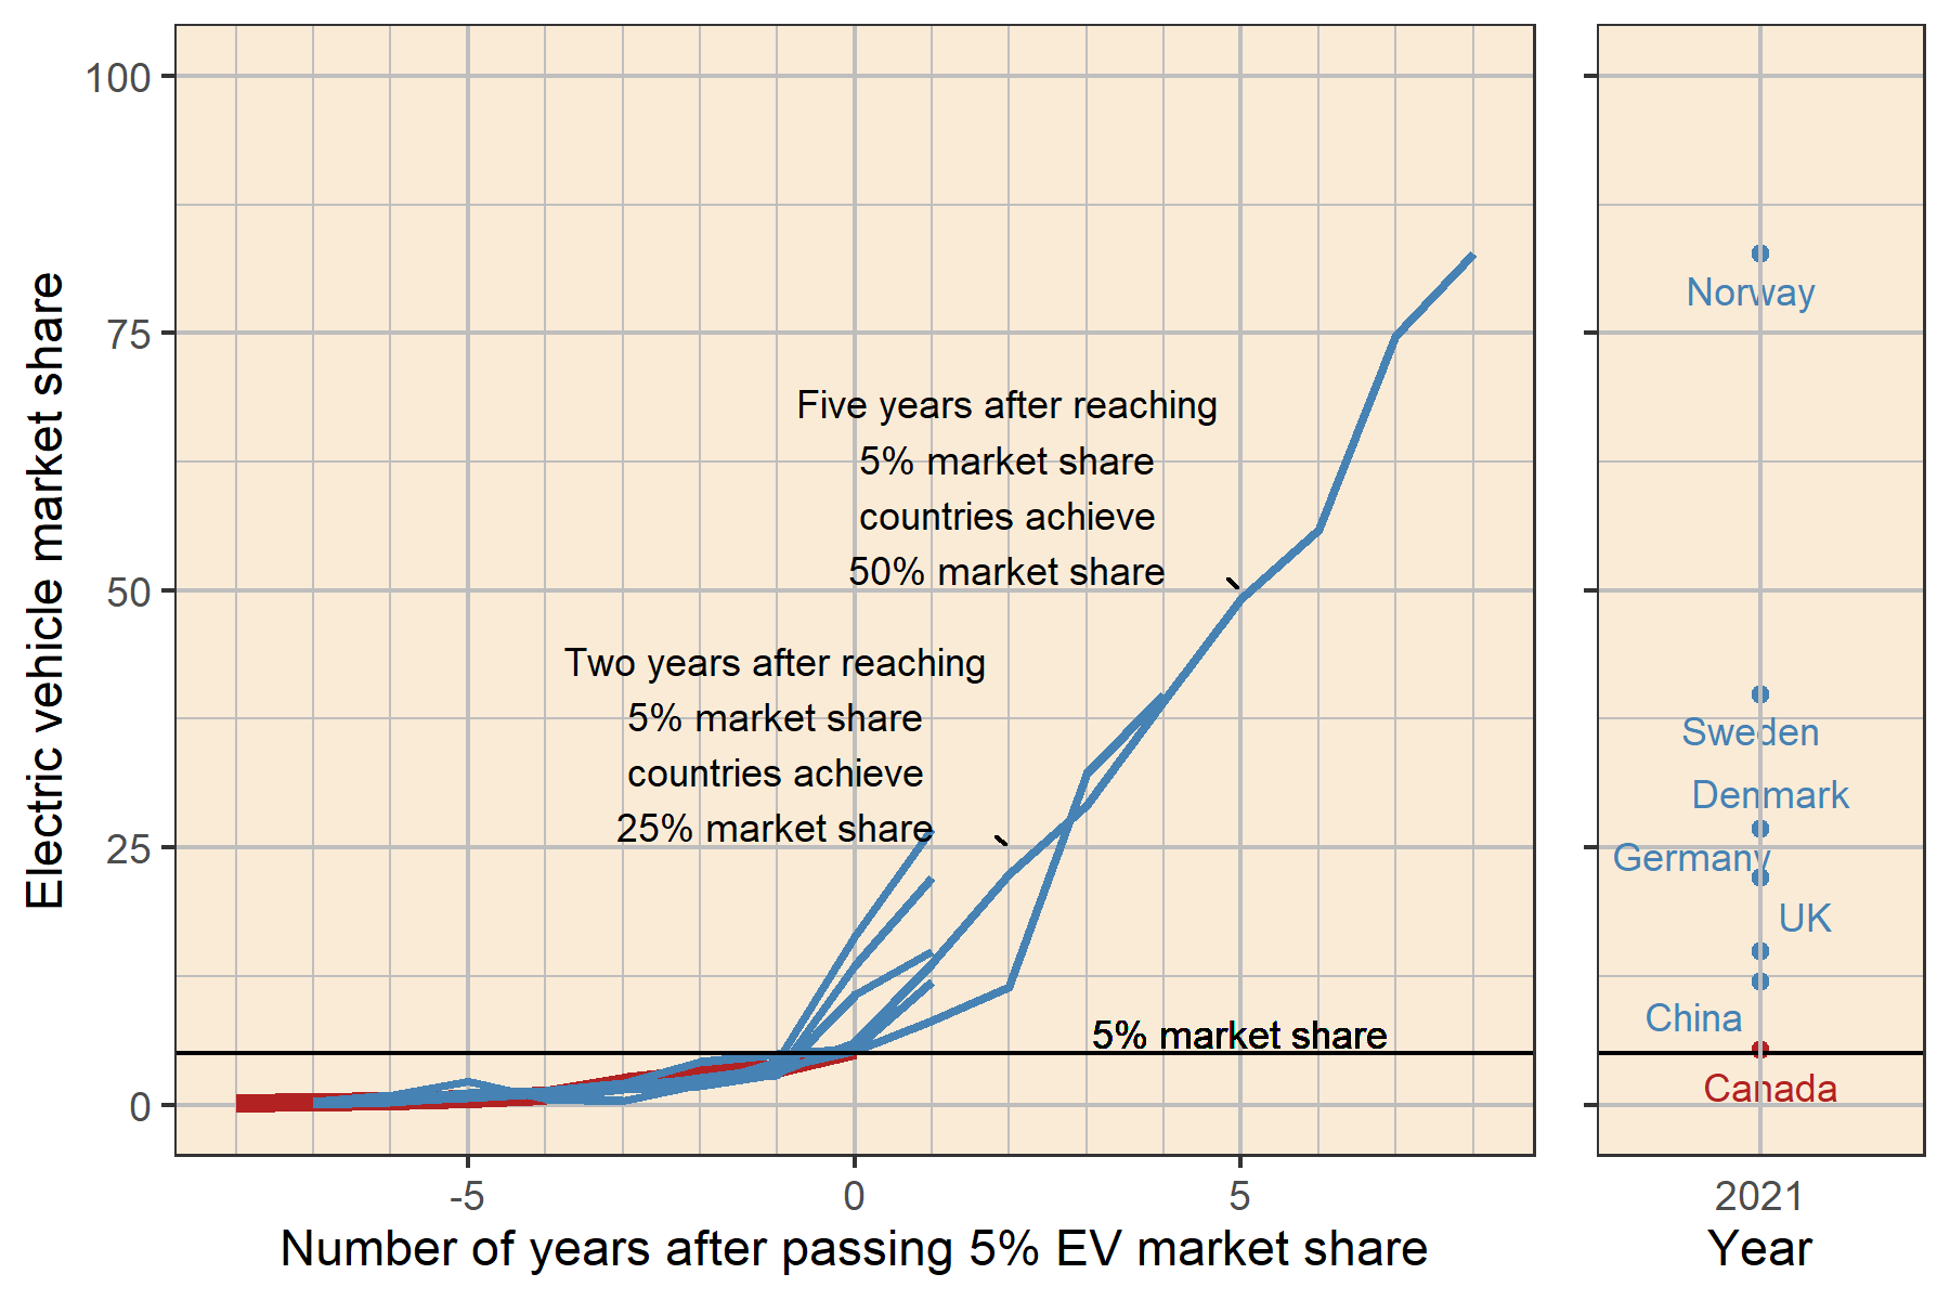
In 2021, for the first time, more than five percent of the vehicles purchased by Canadians were electric. While this is good news for the environment, the right-hand panel in the figure shows that Canada lags behind many other countries in electric vehicle (EV) sales. In 2021, about 10 percent of the vehicles sold in China were electric. In Germany, it was 20 percent; 40 percent in Sweden and 80 percent in Norway.
However, although it has taken Canada and other countries a long time to reach the five percent mark in EV sales (the figure to the left shows that things can change quickly once this mark has been reached). Across all countries shown, EV sales have taken off rapidly after reaching a five percent market share. While Norway hit that mark in 2013 and has a huge lead in electrifying its vehicle fleet as a result, other countries are following a similar trajectory.
For example, just two years after hitting the five percent mark in other countries, 25 percent of all vehicles sold were electric. And five years after passing the five percent mark, countries appear to be on track for EVs to account for 50 percent of vehicle sales. Given the experience in other countries, we should expect a rapid transition in the Canadian vehicle markets in the coming years.
Emissions from road passenger transport account for about 10 percent of Canada’s total greenhouse gas emissions, and a rapid transition to electrification is one way to substantially reduce these emissions.
Big emitters, big decisions
Jennifer Winter, Associate Professor, Department of Economics, University of Calgary @jenwinter_YYC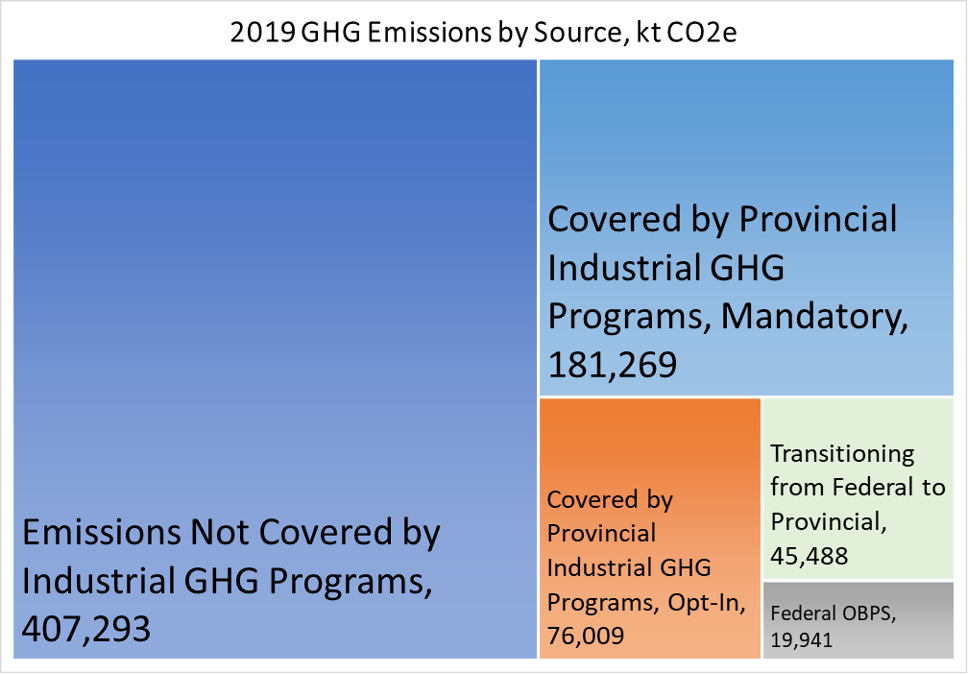
There is a wide variety of emission pricing schemes in Canada for industrial emissions (right half of figure). These include the federal production-based pricing system (OBPS) and numerous provincial programs. The systems involve mandatory participation for some facilities (usually the largest) and voluntary subscription provisions for others. Most of Canada’s industrial emissions are covered by provincial programs, which are generally weaker than the federal system, but the Government of Canada lets it pass. This can change. In 2022, Environment and Climate Change Canada will reevaluate provincial carbon pricing programs against the federal minimum standard. This means that the review has the potential to increase the rigor of large provincial emitter systems if the provinces cooperate. But what if some don’t? Facilities in those provinces could revert to federal OBPS or be subject to federal top-ups. Either way, federal-provincial fireworks are sure to occur. It remains to be seen how much commitment the federal government will bring to this issue. We should find out in 2022.
What is reducing emissions?
Blake Shaffer, Associate Professor, Department of Economics, University of Calgary @bcshaffer
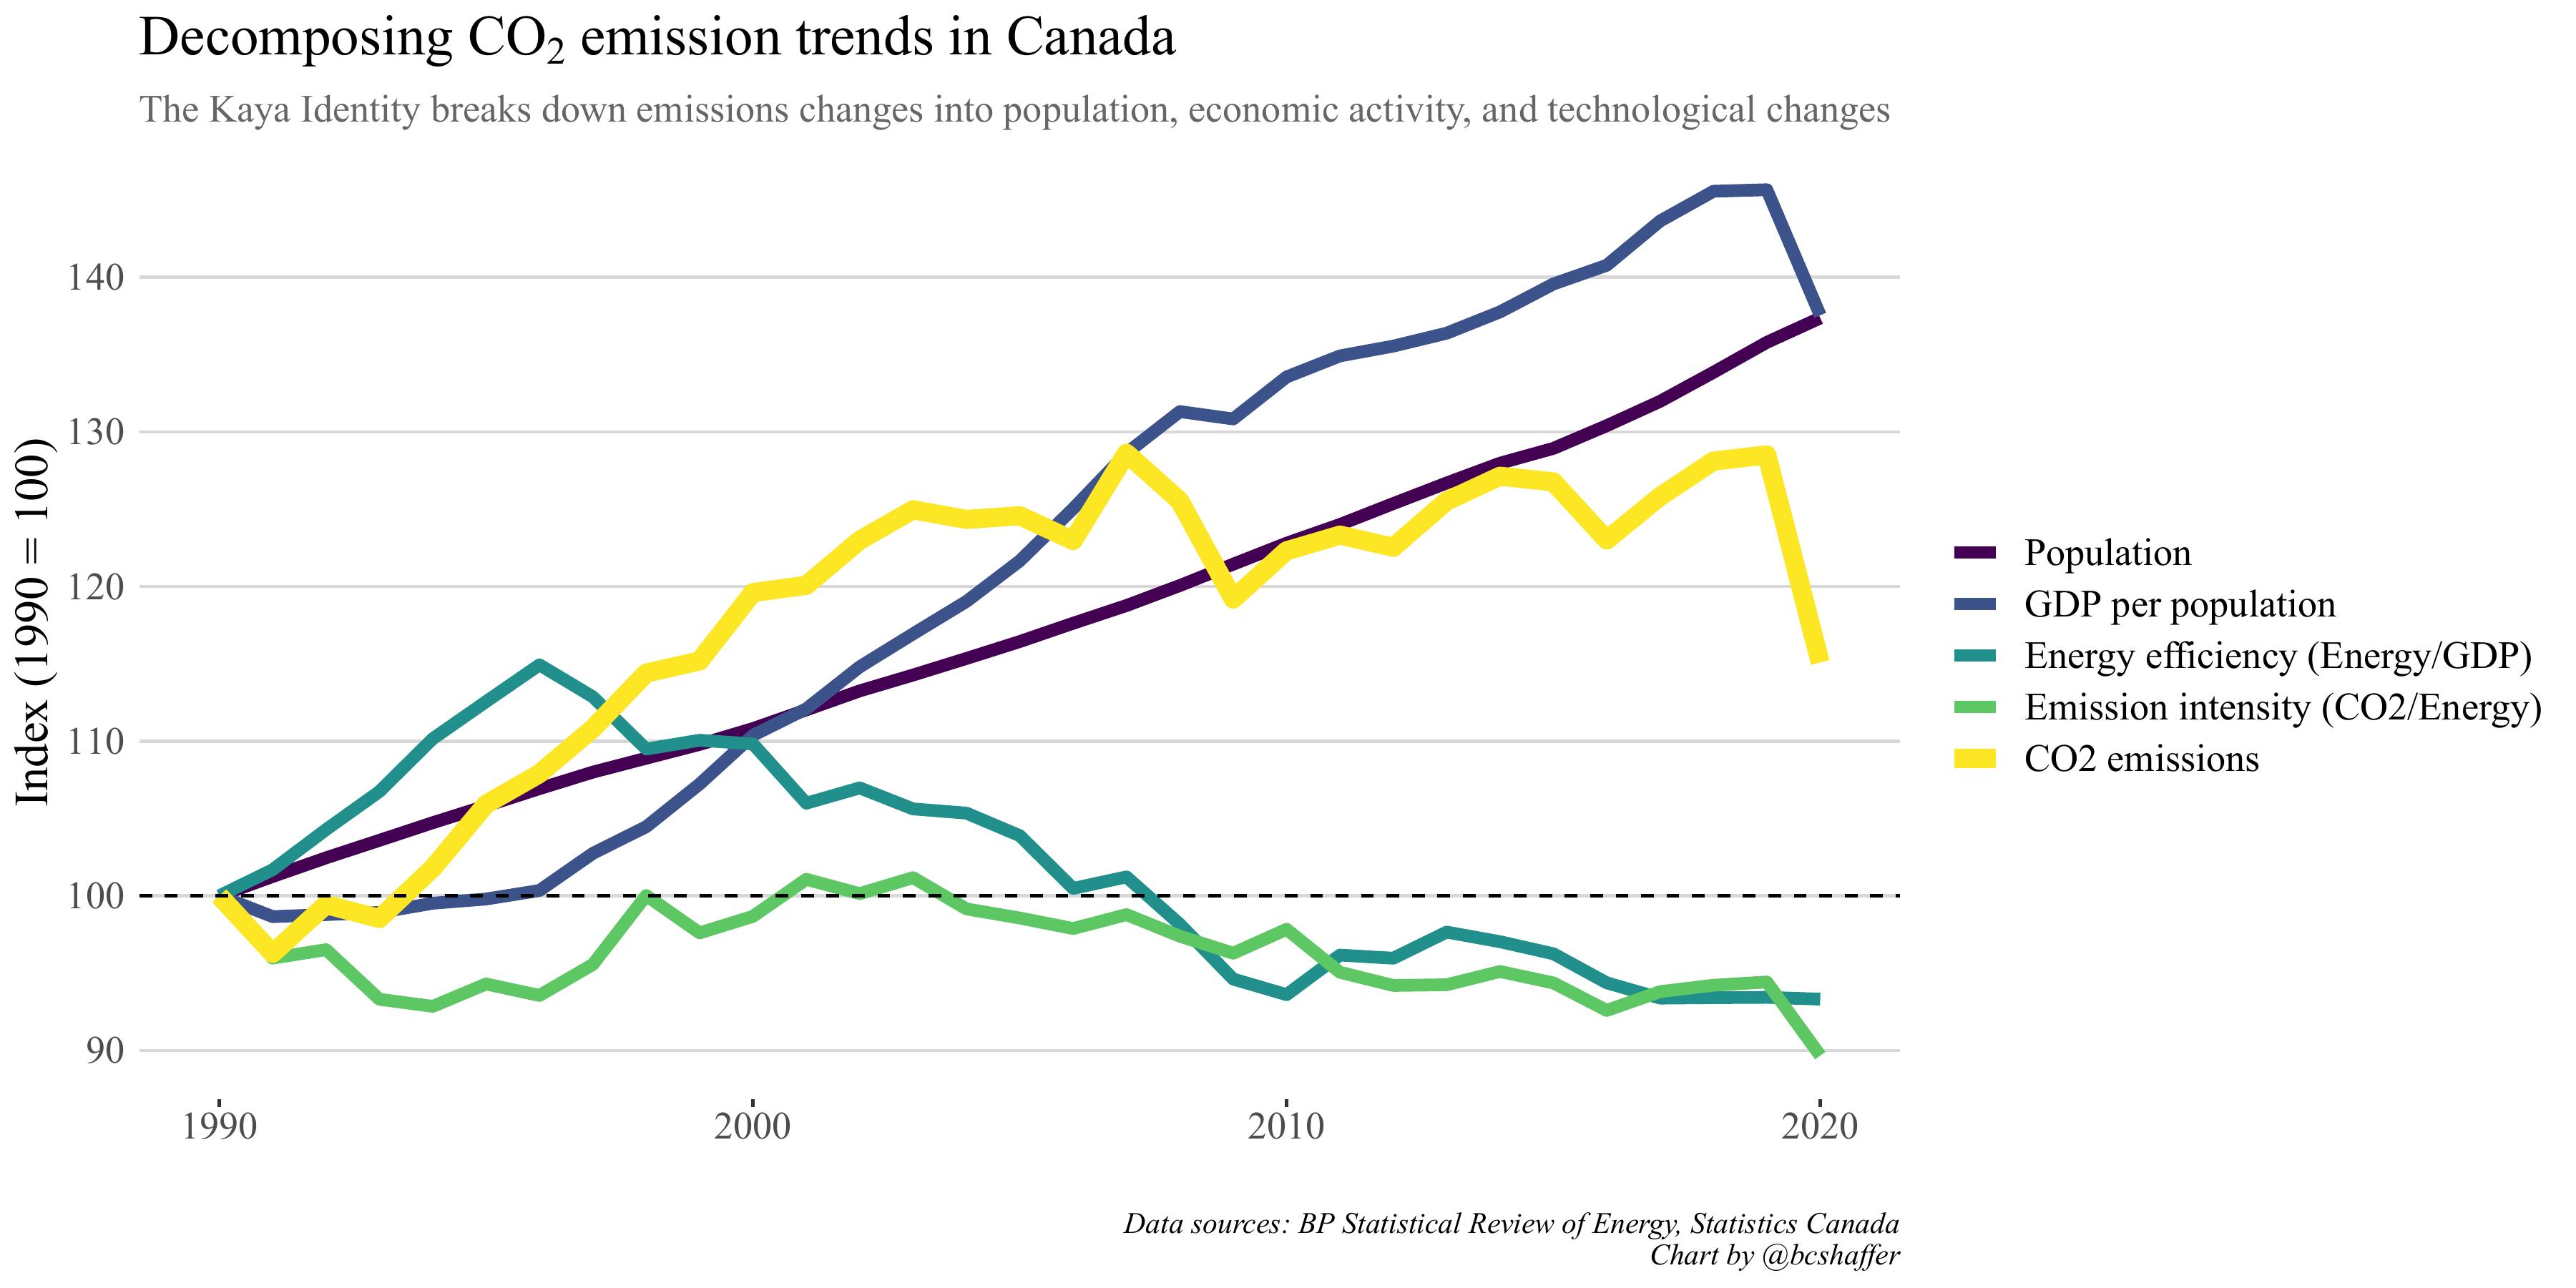
The year 2020 saw a dramatic decrease in carbon dioxide emissions in Canada, dropping roughly 10 percent compared to the previous year. Of course, the COVID-induced shutdown of much of the economy was largely responsible for this decline. But as the graph shows, that’s not all.
The graph is what is known as Then identity, named after the researcher who devised this method to decompose changes in CO2 into: population growth, economic activity, energy efficiency, and emission intensity.
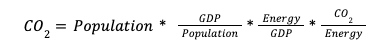
The last two terms represent technological improvements and structural changes, both in the amount of energy we use in our economy and in the intensity of emissions of that energy. Looking closely at 2020, while it is clear that a decrease in economic activity played the main role, an improvement (decrease) in the intensity of emissions also helped reduce CO2 emissions.
Looking ahead to figures for 2021 and beyond (expecting a rebound in economic growth), will improvements in emission intensity and energy efficiency be enough to keep CO2 emissions low?
Near or far? Travel distances and electrification opportunities
Sara Hastings-Simon, Assistant Professor and Director, Master’s Program in Sustainable Energy Development, University of Calgary @S_Hastingssimon
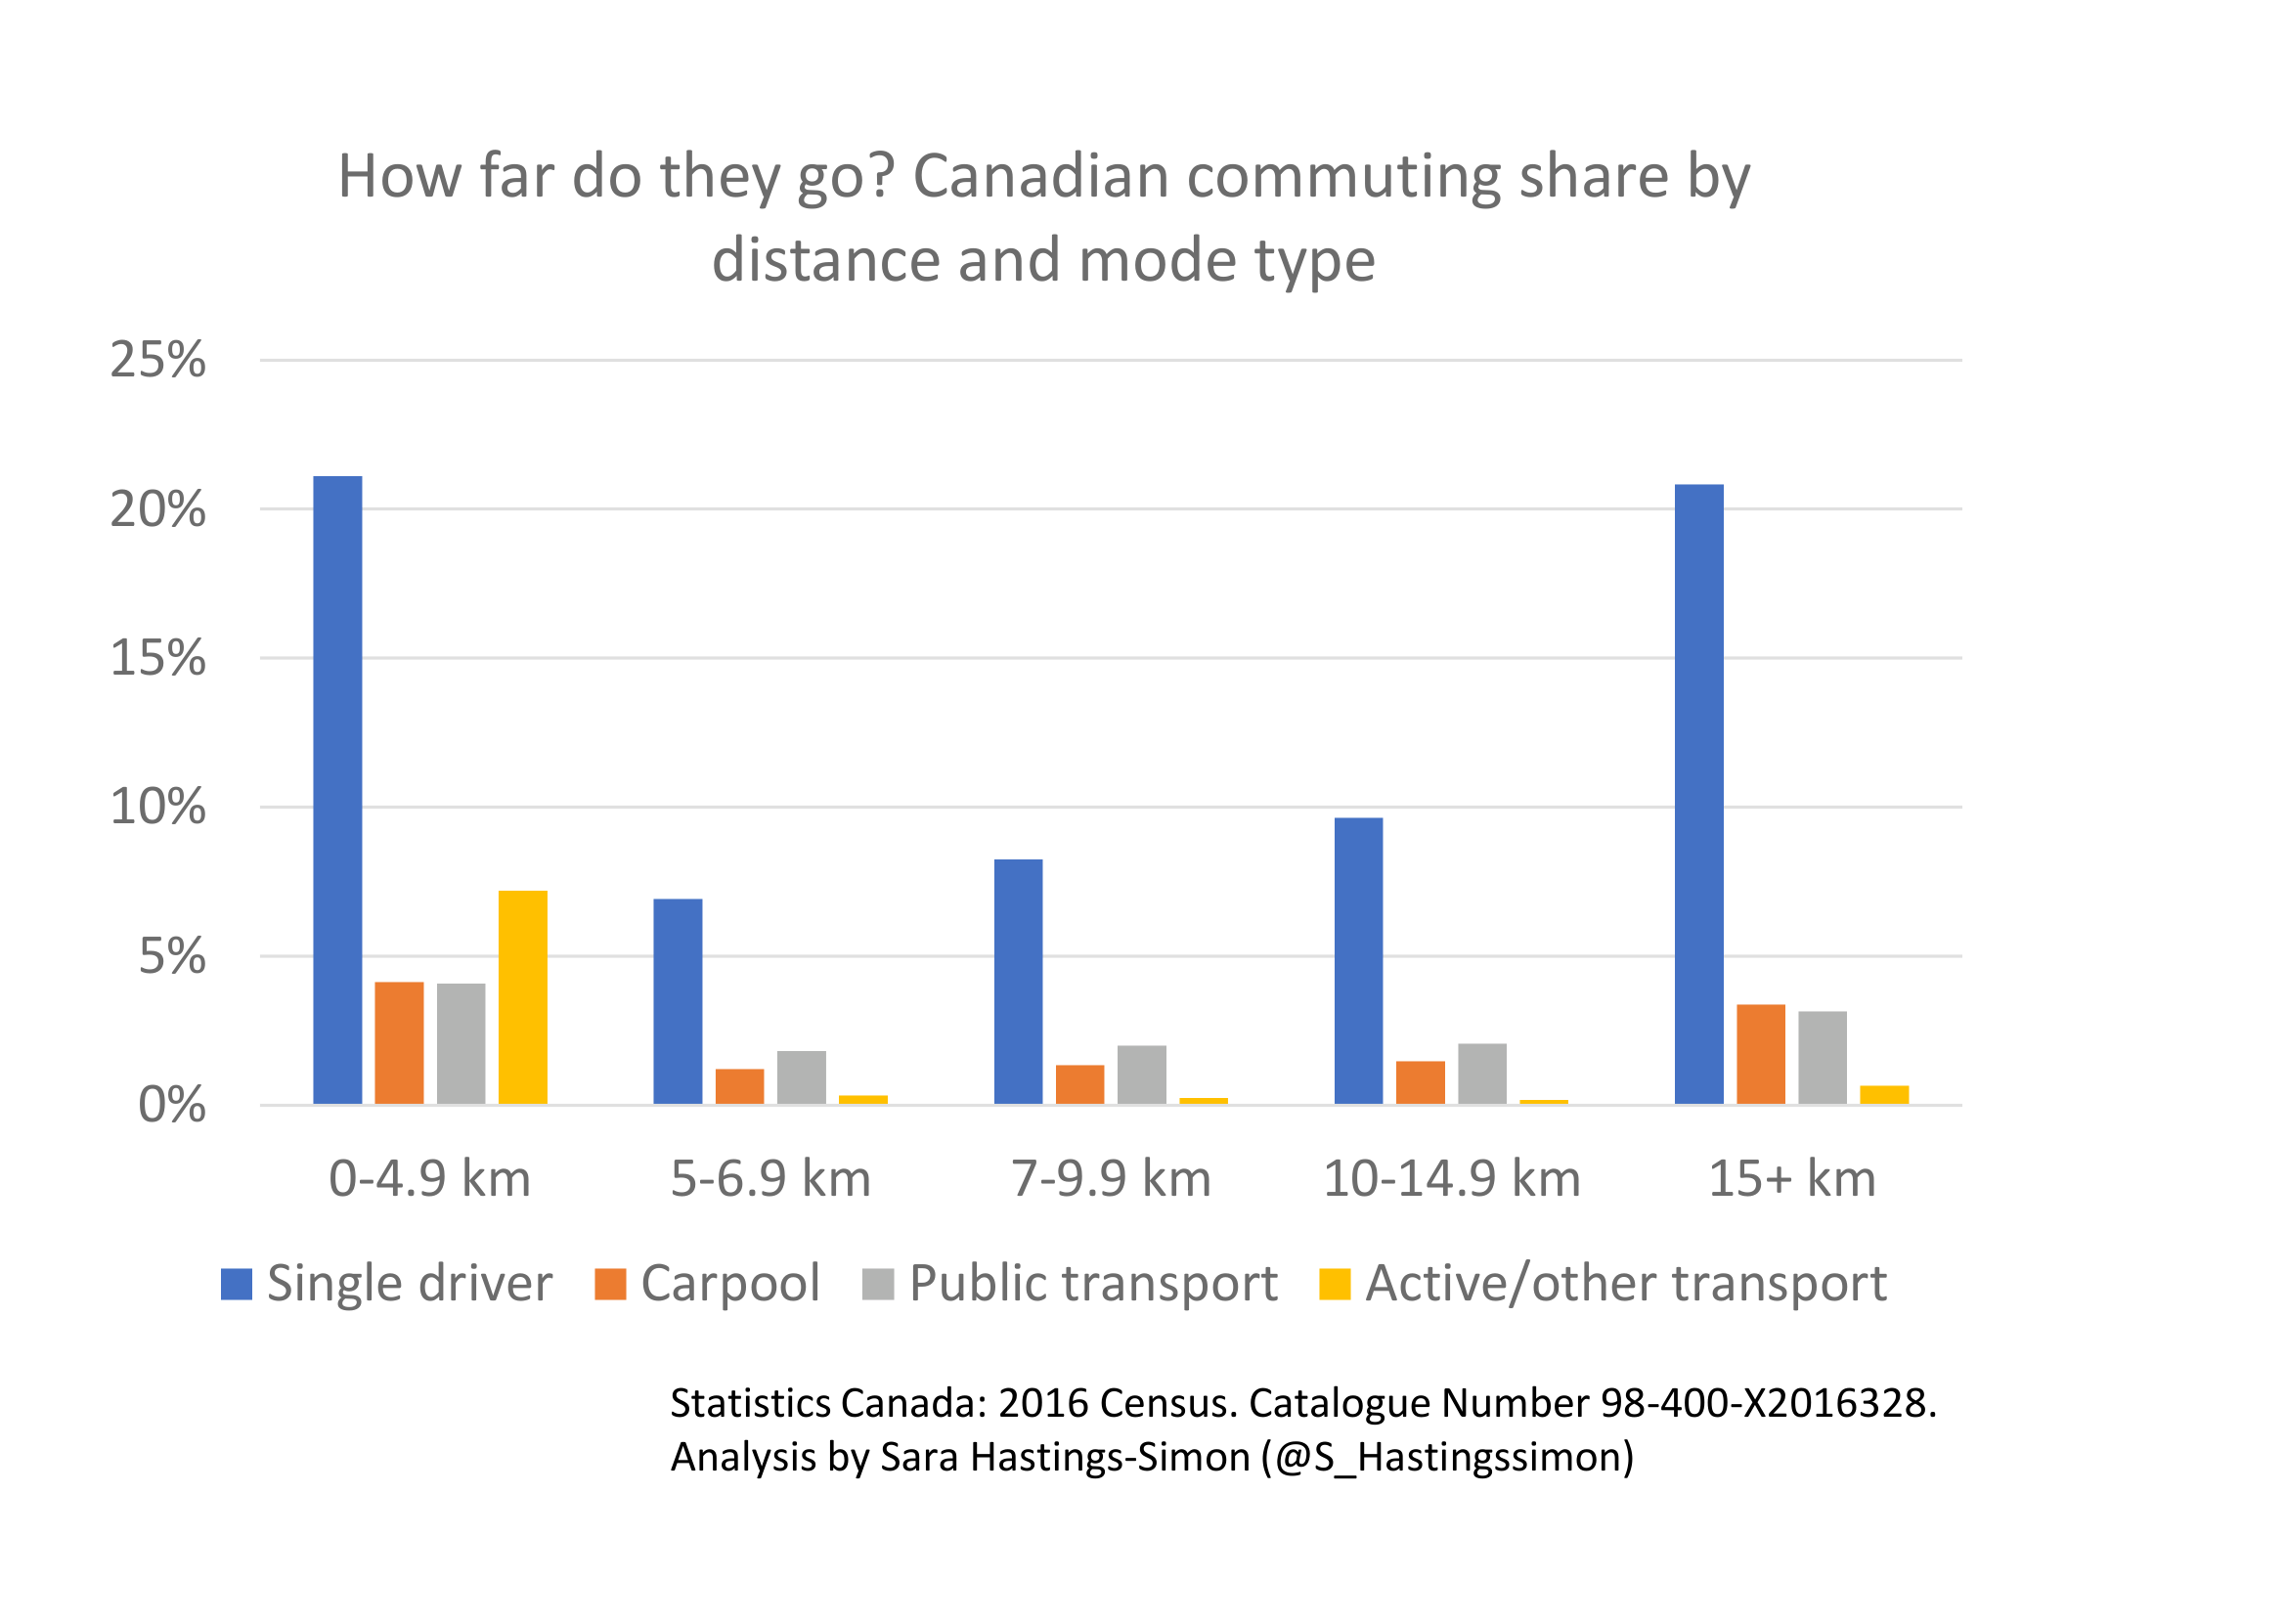
The world’s best-selling electric vehicle is an electric bicycle. With a small motor and battery offering pedaling assistance, a range of models that can carry children, groceries, and even packages for delivery, electric bikes are emerging as a tool in the toolbox for transport decarbonization. Policymakers are seizing the opportunity, with cities building bicycle infrastructure and providing support for the purchase of electric bikes, such as the electric bike tax credit included in the version of the US Build Back Better bill. the camera.
But Canada is a large and sparsely populated country, leaving many wondering how practical bicycles are for the distances we regularly travel. A look at how Canadians commute to work shows that more than 20 percent of trips are made by car and less than three miles. Including daily trips of up to 10 kilometers (or up to 25 minutes), bicycles become an option to replace car trips for more than a third of daily trips, demonstrating the importance of going beyond a single model for all to achieve the Canadian goal. for the reduction of emissions in the transport sector.
One of the biggest barriers for potential cyclists is the lack of safe infrastructure to get from point A to B, so investments in active transportation will likely have the biggest impact on how this chart changes in 2022 and beyond.
Alberta women in energy jobs, or not
Aline Coutinho, Postdoctoral Fellow, Smart Prosperity Institute @ AlineSociology
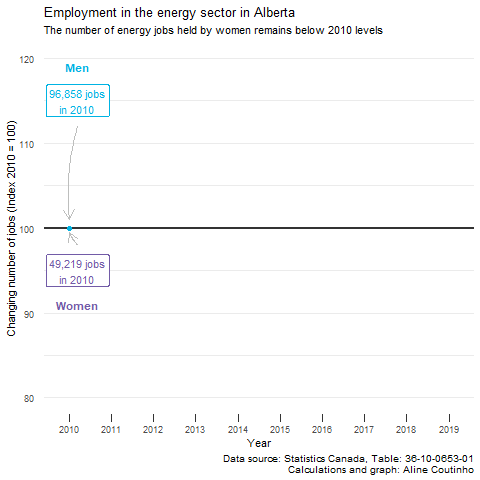
Alberta’s energy sector has historically been dominated by men, but it was even more so after the impact of the 2015 oil price. The loss of employment has disproportionately affected women during the recession, and their recovery has occurred at a slower pace compared to men. Although more than 9,000 men worked in the sector in 2019 compared to 2010, the employment levels of women are still below those observed in 2010.
In 2022, as more data becomes available, we should be watching and examining how these depressing trends change throughout the pandemic, especially in the context of the zero net carbon transition. We need to better understand what factors have hindered the economic recovery of women workers in Albertan’s energy industries, so that we are better equipped to design policies that promote equal economic opportunity for men and women.
Climate change affects crop exports
Tania chaar, Research Assistant, Economics, Export Development Canada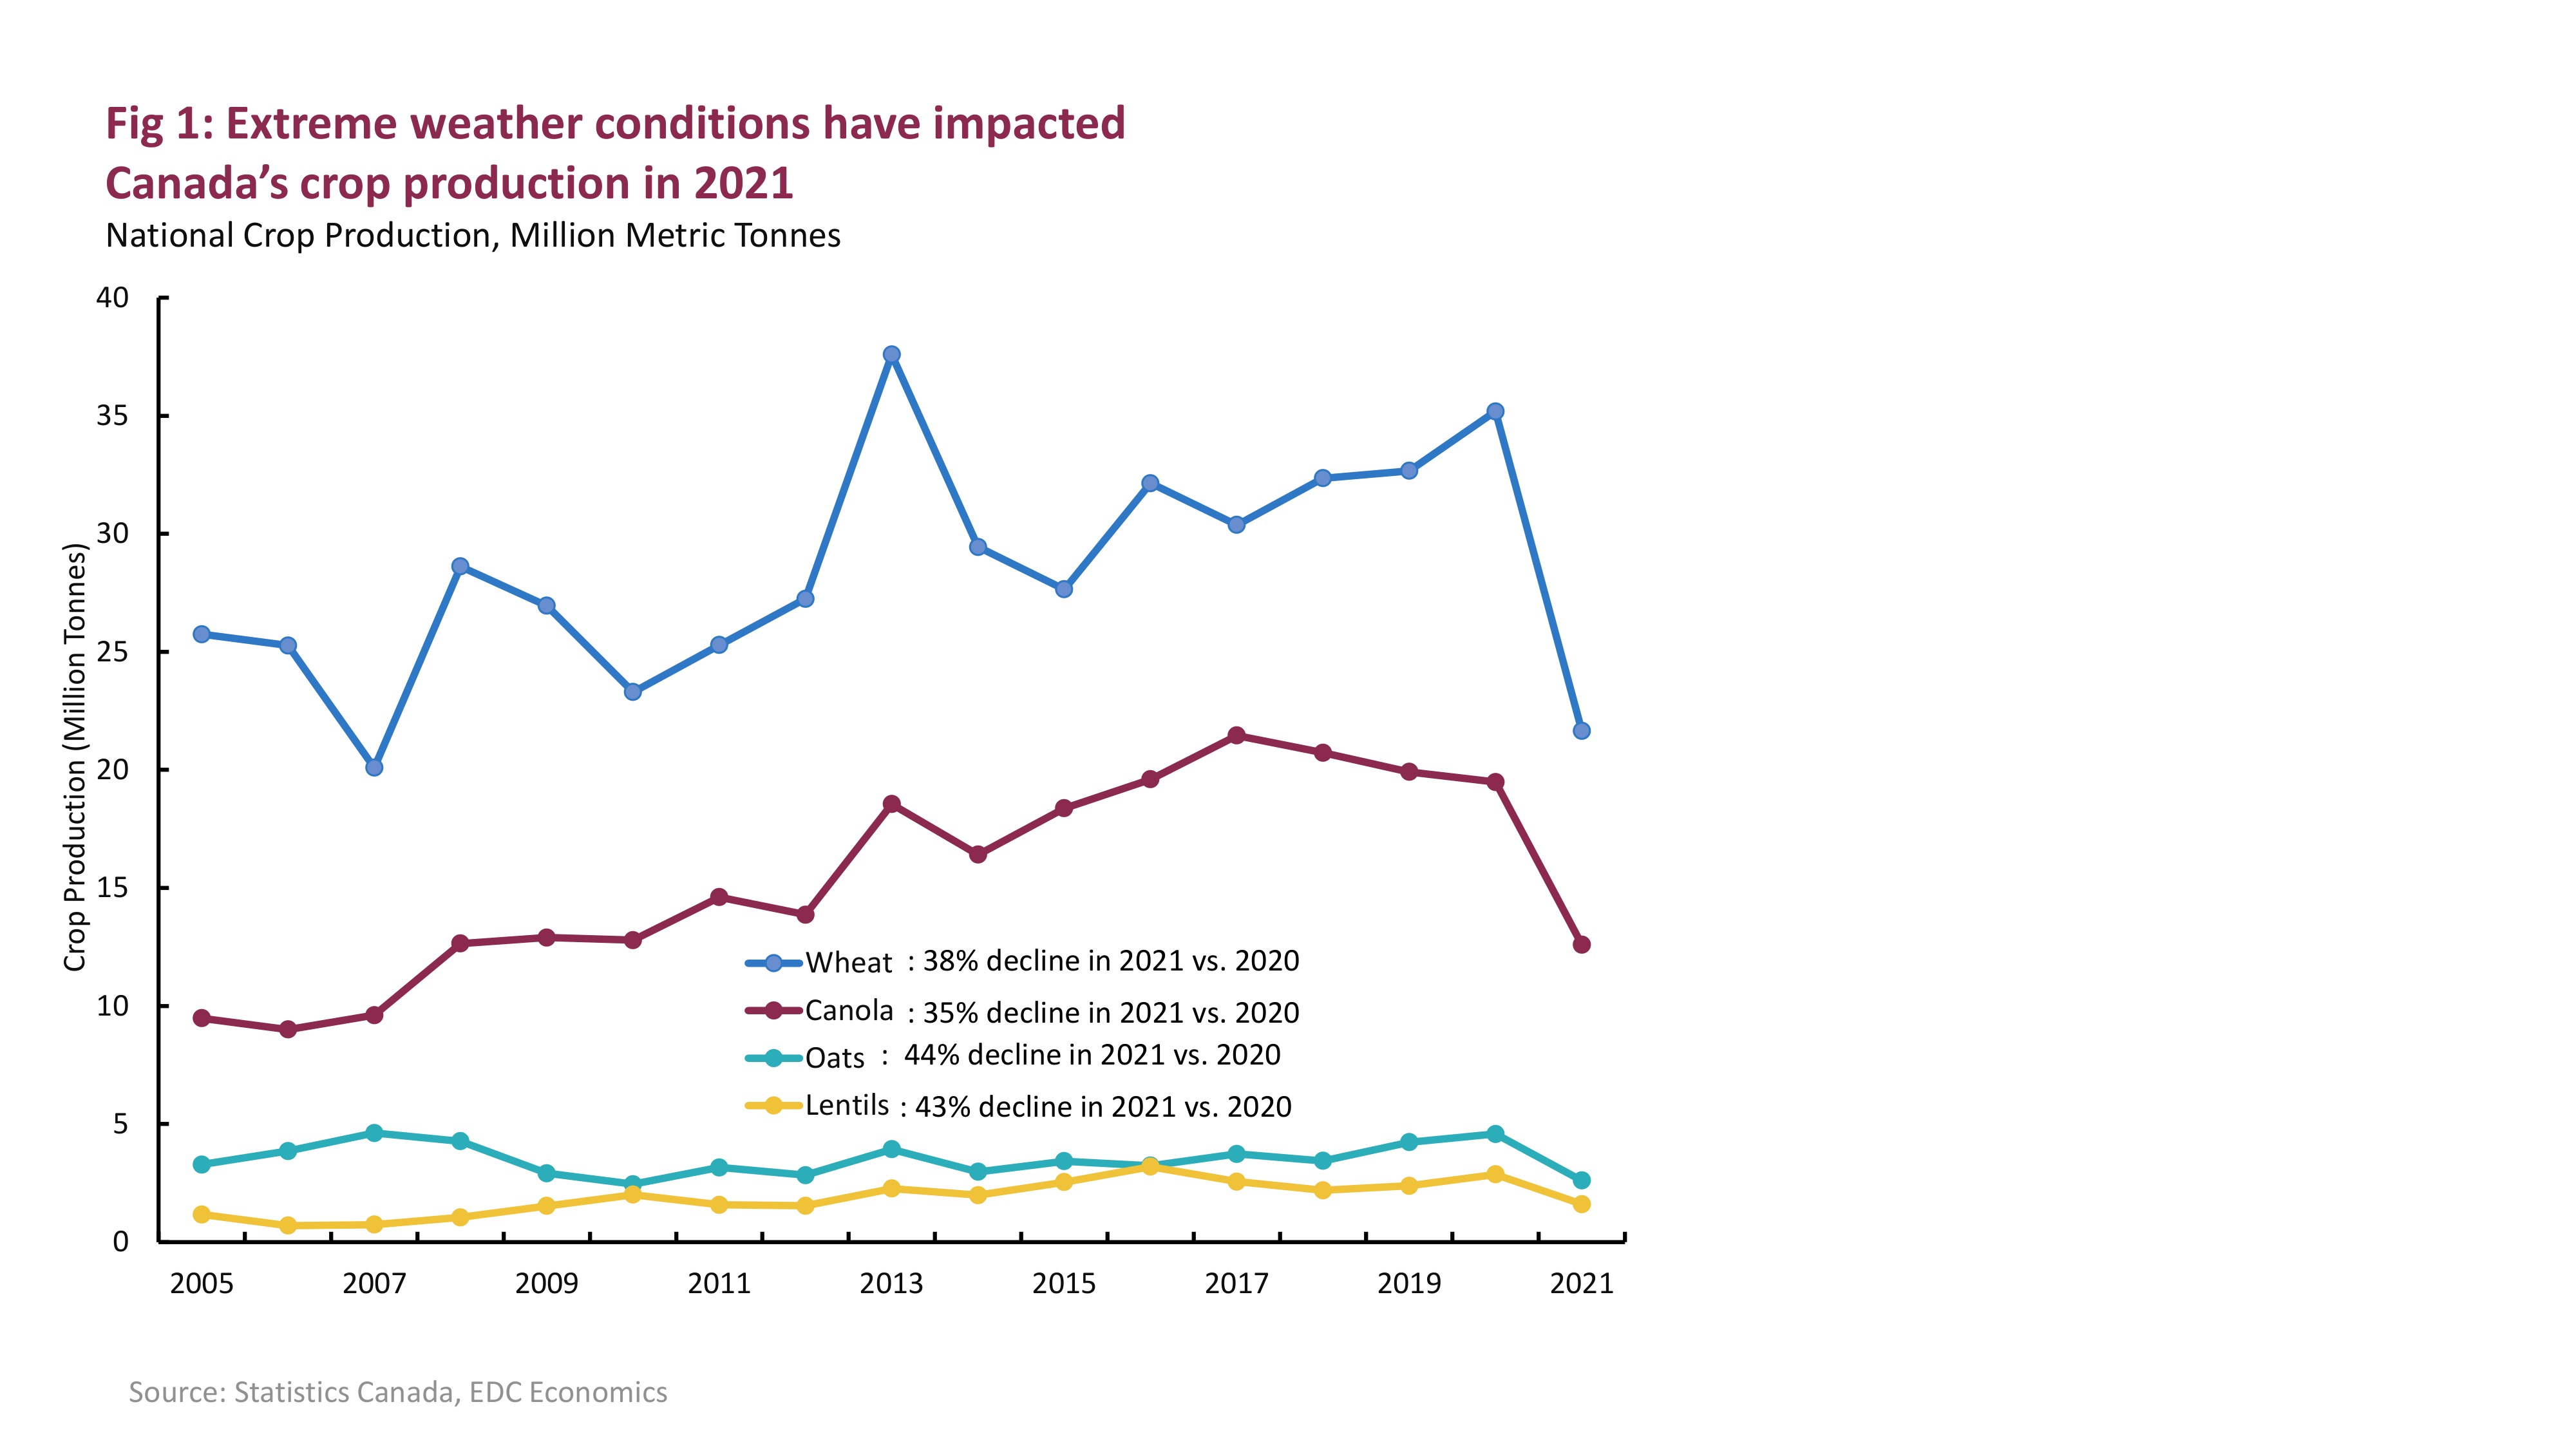
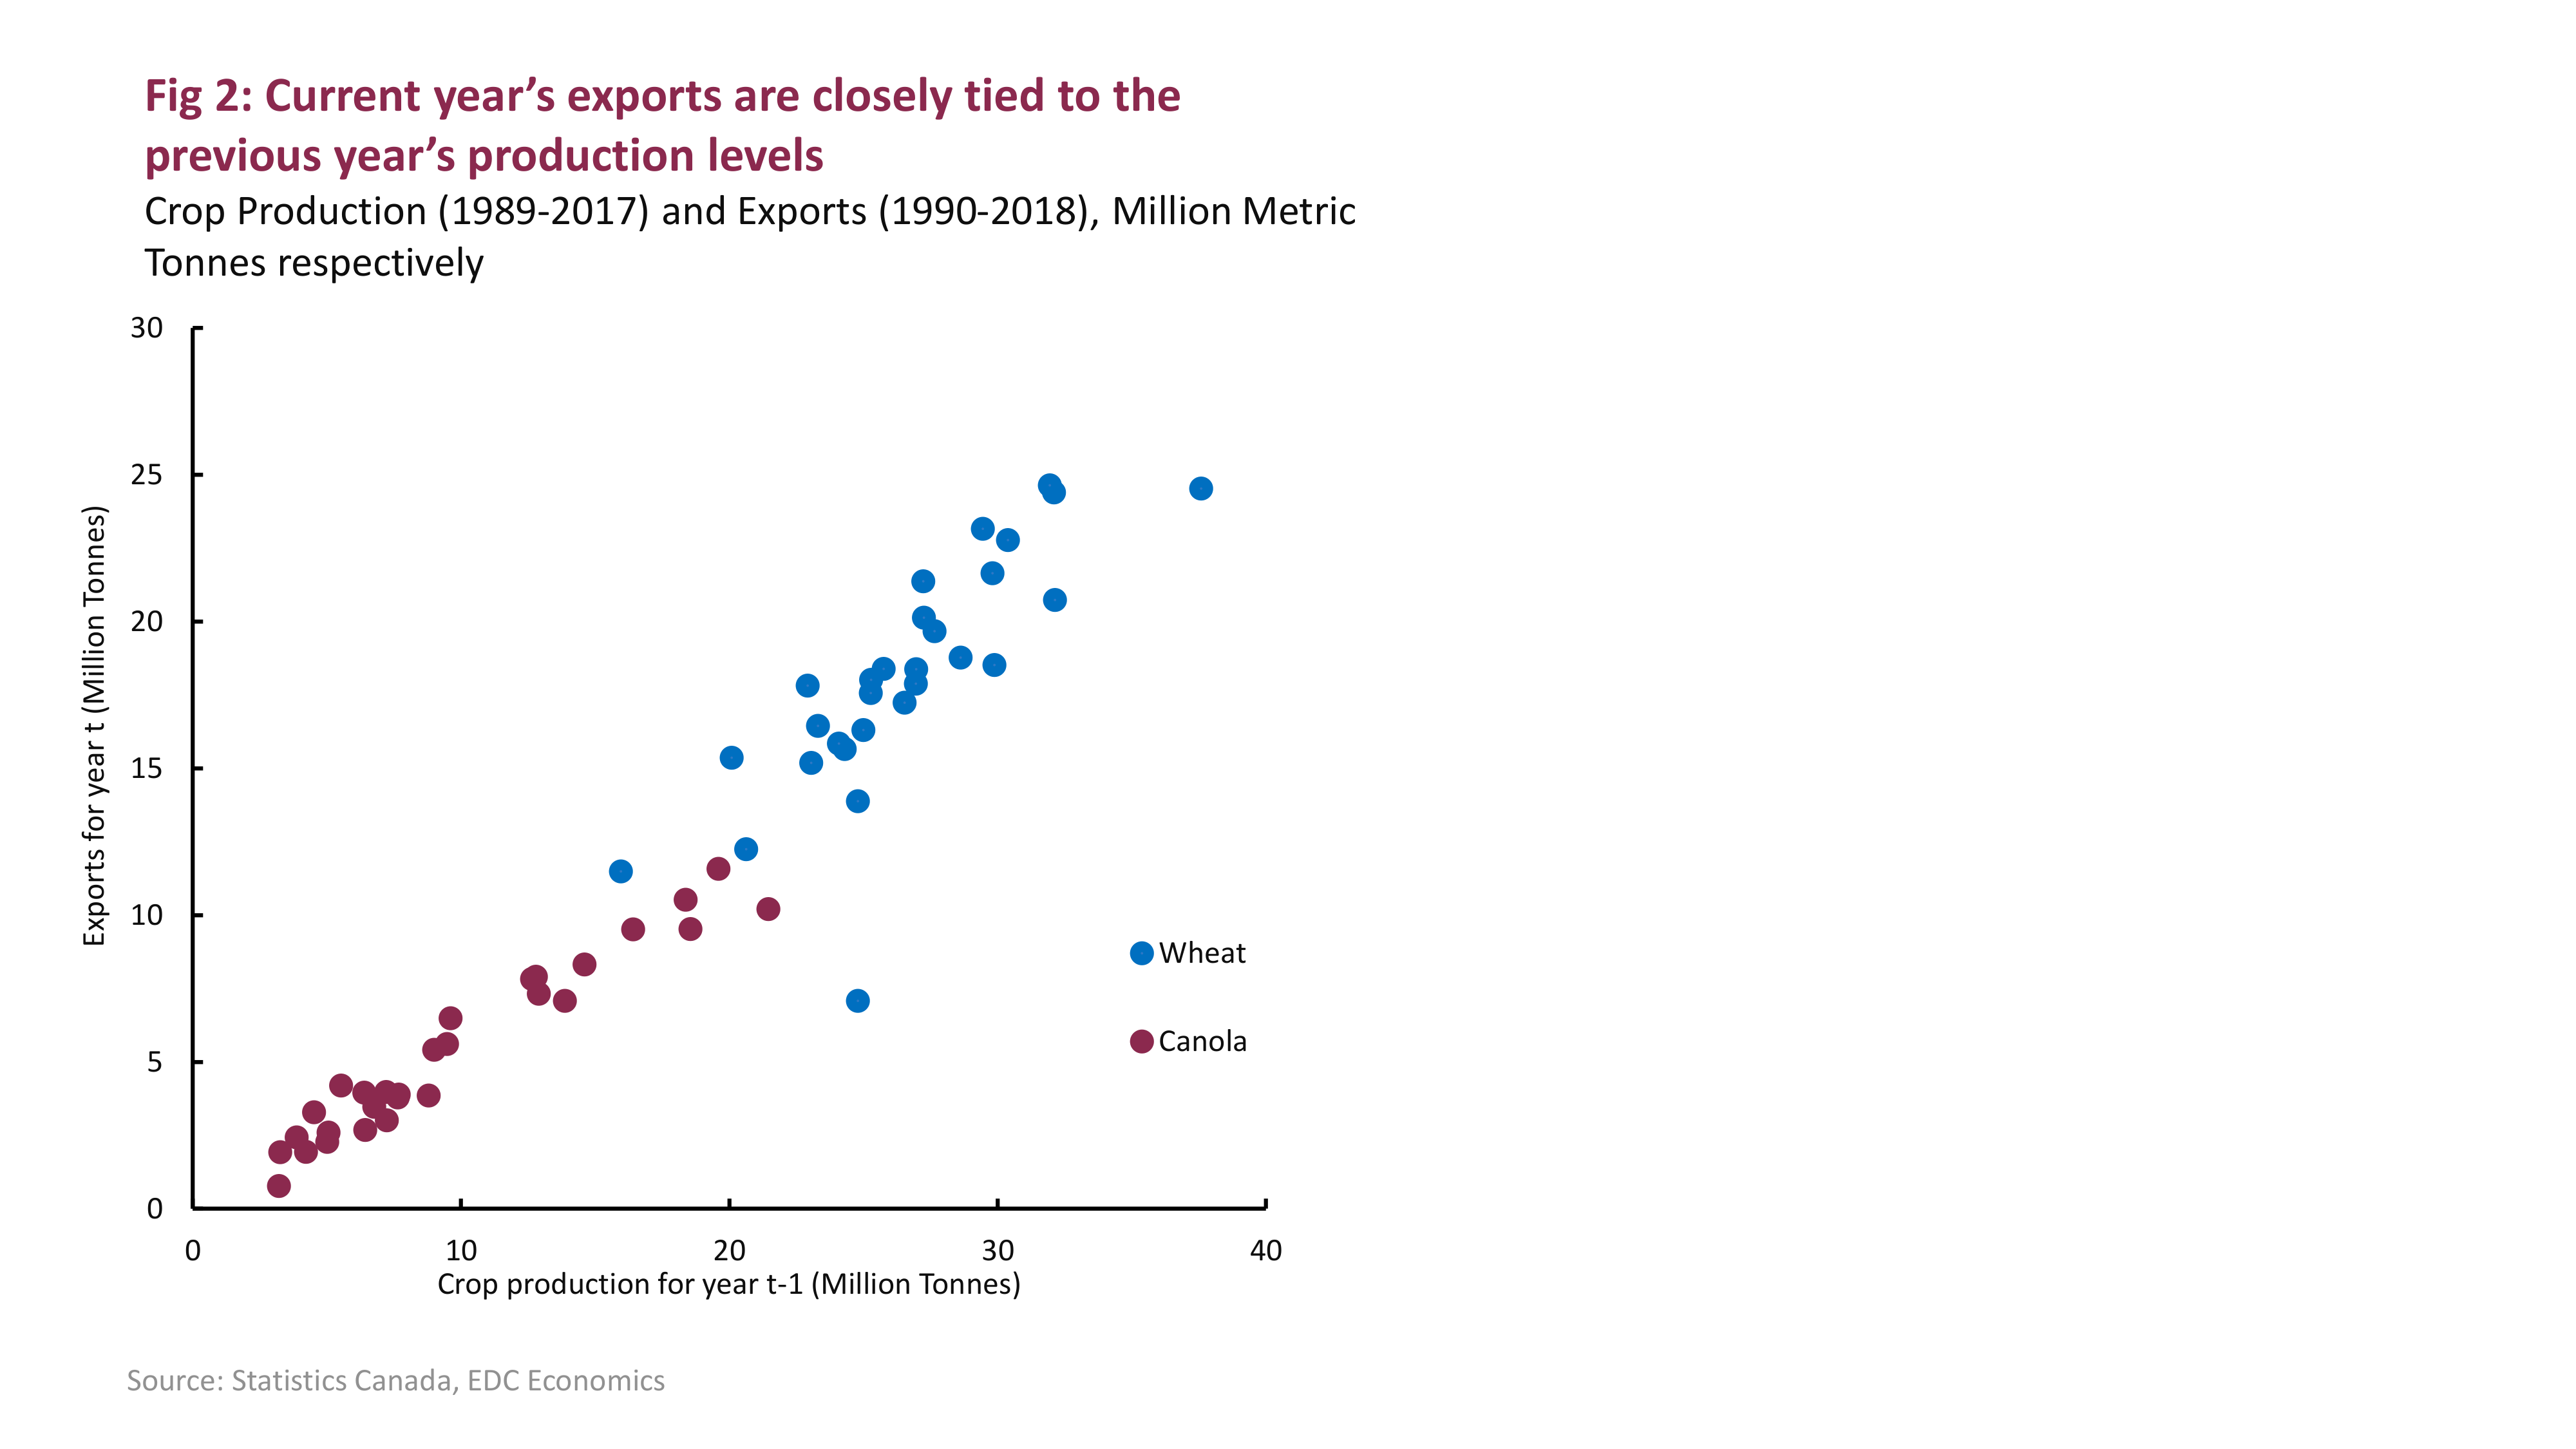
Extreme weather conditions have been a challenging consequence of climate change for the Canadian agri-food industry. During the 2021 growing season, prairie farmers struggled with one of the worst droughts in Canadian history, causing crop production for our top agricultural exports to plummet. Compared to 2020, production across all major crops decreased by 29 percent (this equates to just over 27 million metric tons). This production shortfall was most severe for crops such as wheat and canola (see Figure 1 above), which have accounted for at least 50 percent of Canada’s total crop exports. since 2009 and where Canada is one of the world’s leading providers.
What does this mean for Canadian agri-food exports in 2022? A quick look at past data from Canada shows that the previous year’s production levels are closely tied to the current year’s exports, as shown in Figure 2. With such a drastic drop in Canadian production levels Next year’s markets that depend on a high-quality supply of wheat and canola, such as China and the United States, may have to contend with a shortfall, along with potentially higher domestic prices for Canadians. Clearly, the Canadian agricultural sector is already feeling the impacts of climate change. Other extreme weather events pose significant risks to the future growth of Canada’s agricultural exports.
Roller Coaster Bumps (and Buying Opportunities)
Martin Pelletier, Senior Portfolio Manager, Wellington-Altus Private Advisor (@mpelletierCIO)
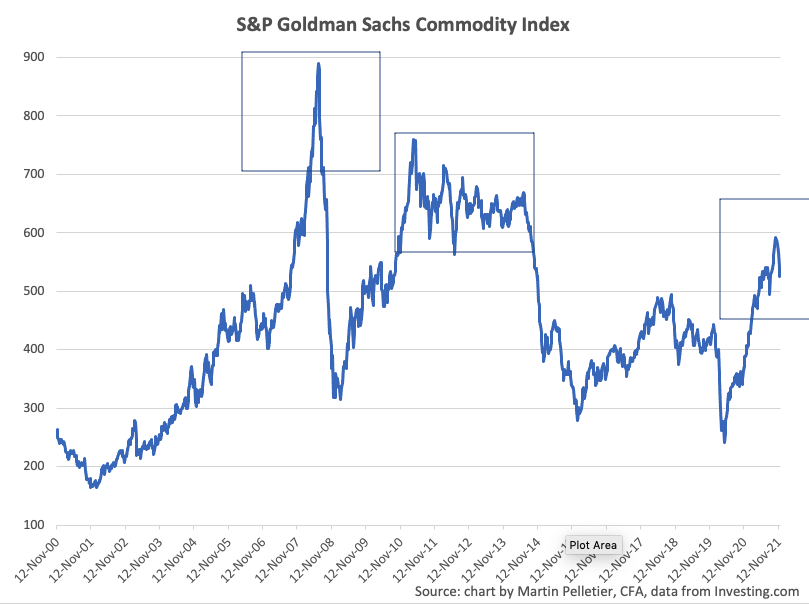
Commodity prices have been on a veritable roller coaster ride with a lot of attention paid to the monstrous recovery from last year’s COVID lows. That said, by some perspective, the index is up just eight to 10 percent from its pre-COVID levels, as it has already started to sell more than 10 percent from its recent October highs on US concerns. Omicron variant.
While there has been much talk about whether or not inflation is transitory, coupled with the recent recognition of higher prices by the Fed, the fact is that commodity prices are still well below where they were before. the financial crisis and the period after its recovery. . We think the feds know this and are in no rush to raise interest rates, certainly not at this stage of the recovery.
As the world returns to a life that is learning to live with COVID, consumers are looking beyond Omicron, despite what politicians say, as a means to further reduce prices. The good news is that we believe the current pricing environment remains conducive to supporting the economic recovery. Should the liquidation continue, we believe one should consider adding some inflation insurance to their portfolio by adding a broader exposure to commodities.
Reference-www.macleans.ca